
We are collecting month-long aggregated traffic logs for different traffic groups from 9 major ISPs in Japan twice per year, in May and November, in order to analyze the macro-level impact of residential broadband traffic. These traffic groups are carefully selected to be summable, and not to count the same traffic multiple times.
The participating ISPs are BIGLOBE, IIJ, J:COM, KDDI, Nifty, NTT Communications, NTT Plala, Optage, and SoftBank (former Softbank Telecom and fomer Softbank BB).
Fig. 1 shows the number of boradband subscriners in Japan. (The gap at 2010/03 is due to a change in data collection methods of some CATV service providers. The cap at 2023/06 is due to an amended contract number from an ISP.)
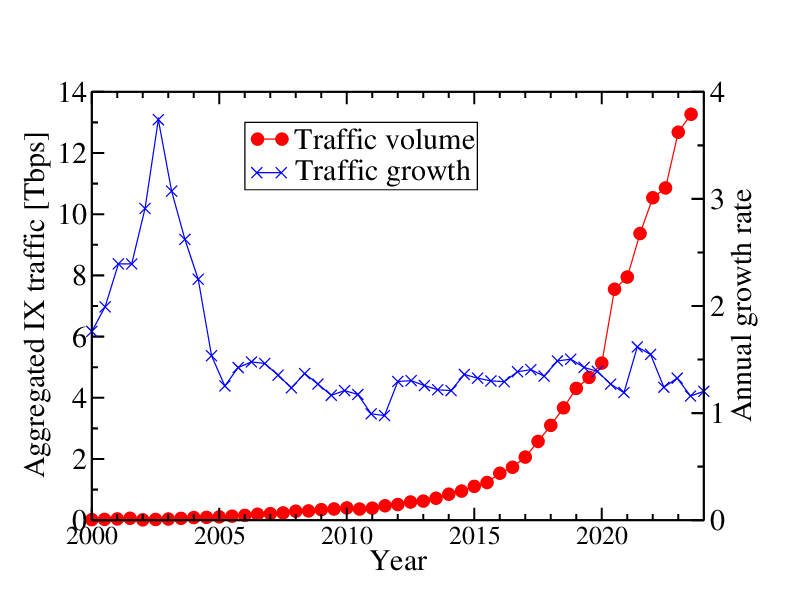
Fig. 2 shows aggregated traffic and its growth rate at major IXes in Japan, namely JPIX, JPNAP, NSPIXP, BBIX, and Equinix.
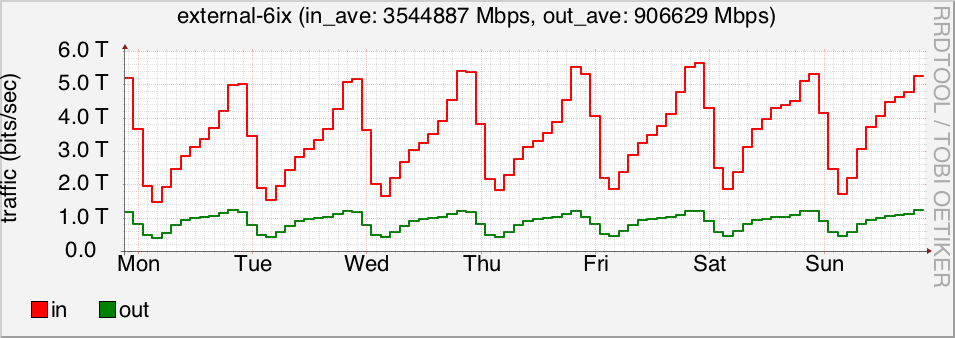
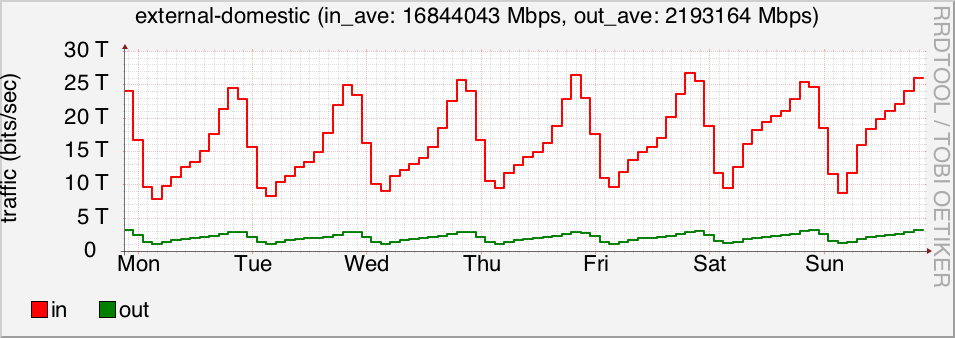
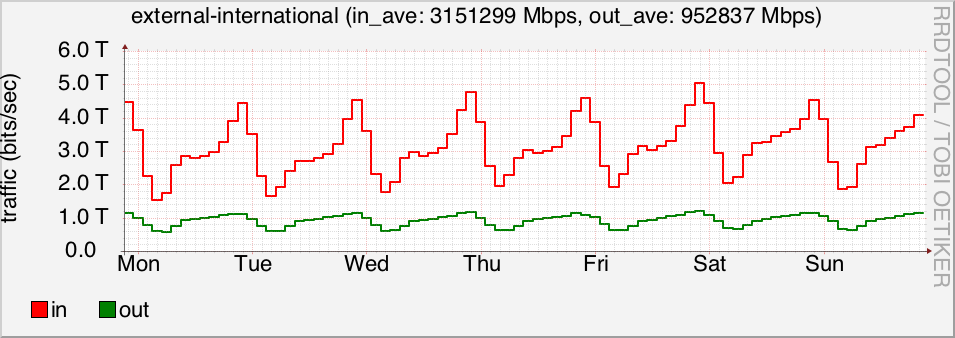
We have been collecting traffic volumes crossing ISP boundaries which can be roughly divided into customer traffic, and external provider traffic such as peering and transit. For practical purposes, we selected the five traffic groups in for data collection:
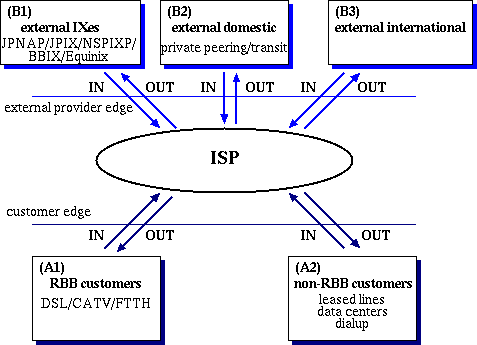
These groups are chosen by the existing operational practices of the participating ISPs because it is impossible to draw a strict line for grouping, e.g., residential/business and domestic/international, on the global Internet. We re-aggregate each ISP's aggregated logs, and only the resulting aggregated traffic is used in our study so as to not reveal the share of each ISP.
Each ISP provided month-long traffic logs aggregated for each traffic group by a log aggregation tool we developed. This allows ISPs not to disclose the internal structure of their network or unneeded details of their traffic. The final results were obtained by aggregating all traffic logs provided by the six ISPs.
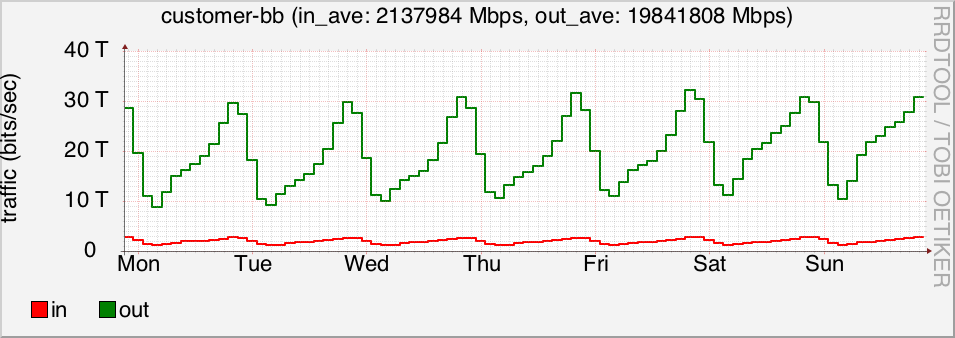
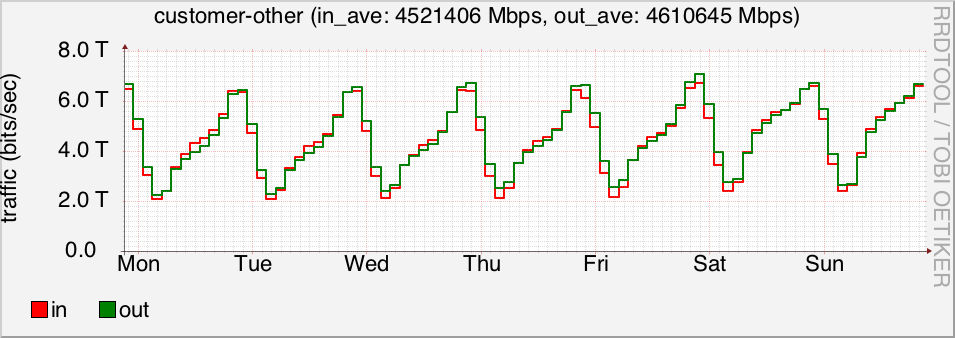
The time resolution of the logs is 2 hours since it was the highest common factor for month-long data in MRTG and RRDtool; 2-hour boundaries in UTC fall on odd hours in Japanese Standard Time (UTC+9). Note that, IN and OUT are presented from the ISPs' point of view.
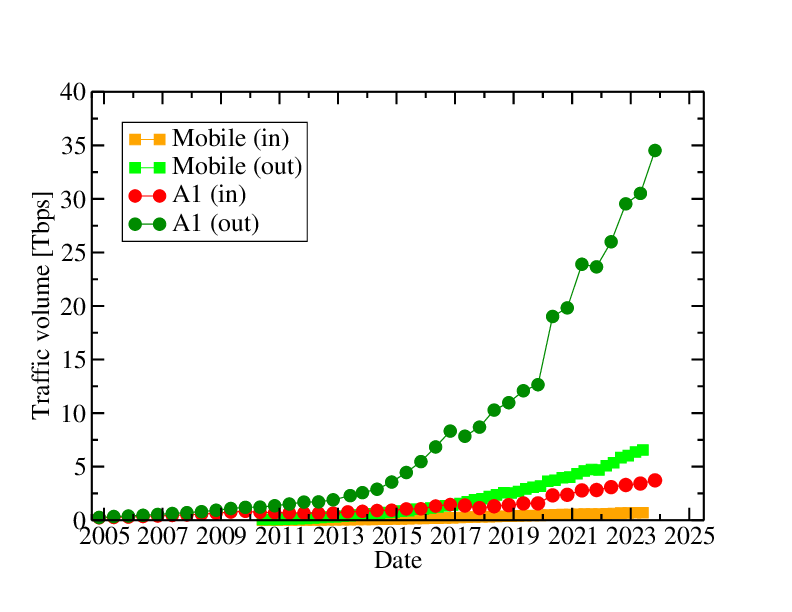
The monthly average rates in bits/second of the traffic groups are shown in Table 2 and their growth is illustrated in Fig. 9 and 10.


The decrease at 2010/05 seems to be an impact of the amended Copyright Act making the download of copyright infringing content illegal. The increase of A2 IN at 2016/11 is a result of re-examination for classifying CDN caches into A2. The gap between 2016/11 and 2017/05 is a transition from 5 ISPs to 9 ISPs.
| year | month | (A1)customer-bb | (A2)customer-other | (B1)external-6ix | (B2)external-domestic | (B3)external-international | |||||
|---|---|---|---|---|---|---|---|---|---|---|---|
| in(Gbps) | out(Gbps) | in(Gbps) | out(Gbps) | in(Gbps) | out(Gbps) | in(Gbps) | out(Gbps) | in(Gbps) | out(Gbps) | ||
| 2004 | 09 | 98.1 | 111.8 | 14.0 | 13.6 | 35.9 | 30.9 | 48.2 | 37.8 | 25.3 | 14.1 |
| 10 | 108.3 | 124.9 | 15.0 | 14.9 | 36.3 | 31.8 | 53.1 | 41.6 | 27.7 | 15.4 | |
| 11 | 116.0 | 133.0 | 16.2 | 15.6 | 38.0 | 33.0 | 55.1 | 43.3 | 28.5 | 16.7 | |
| 2005 | 5 | 134.5 | 178.3 | 23.7 | 23.9 | 47.9 | 41.6 | 73.3 | 58.4 | 40.1 | 24.1 |
| 11 | 146.7 | 194.2 | 36.1 | 29.7 | 54.0 | 48.1 | 80.9 | 68.1 | 57.1 | 39.8 | |
| 2006 | 05 | 173.0 | 226.2 | 42.9 | 38.3 | 66.2 | 60.1 | 94.9 | 77.6 | 68.5 | 47.8 |
| 11 | 194.5 | 264.2 | 50.7 | 46.7 | 68.4 | 62.3 | 107.6 | 90.5 | 94.5 | 57.8 | |
| 2007 | 05 | 217.3 | 306.0 | 73.8 | 57.8 | 77.4 | 70.8 | 124.5 | 108.4 | 116.4 | 71.2 |
| 11 | 237.2 | 339.8 | 85.4 | 63.2 | 93.5 | 83.4 | 129.0 | 113.3 | 133.7 | 81.8 | |
| 2008 | 05 | 269.0 | 374.7 | 107.0 | 85.0 | 95.7 | 88.3 | 141.2 | 119.4 | 152.6 | 94.4 |
| 11 | 302.0 | 432.9 | 122.4 | 88.7 | 107.5 | 102.5 | 155.6 | 132.3 | 176.1 | 110.8 | |
| 2009 | 05 | 349.5 | 501.0 | 154.4 | 121.4 | 111.7 | 104.9 | 185.0 | 155.4 | 213.1 | 126.4 |
| 11 | 373.6 | 539.7 | 169.4 | 127.6 | 114.3 | 109.8 | 209.5 | 154.3 | 248.2 | 148.3 | |
| 2010 | 05 | 321.9 | 536.4 | 178.8 | 131.2 | 94.1 | 91.0 | 194.8 | 121.4 | 286.9 | 155.5 |
| 11 | 311.1 | 593.0 | 190.1 | 147.5 | 90.1 | 91.6 | 198.7 | 117.2 | 330.1 | 144.9 | |
| 2011 | 05 | 302.5 | 662.0 | 193.9 | 174.4 | 98.4 | 90.0 | 242.9 | 131.5 | 420.9 | 160.5 |
| 11 | 293.6 | 744.5 | 221.9 | 207.5 | 102.9 | 89.4 | 265.1 | 139.1 | 498.5 | 169.6 | |
| 2012 | 05 | 287.8 | 756.6 | 251.5 | 243.0 | 118.4 | 98.6 | 317.4 | 145.1 | 528.7 | 178.8 |
| 11 | 294.0 | 840.3 | 268.3 | 257.2 | 103.2 | 83.2 | 316.6 | 135.7 | 571.3 | 201.6 | |
| 2013 | 05 | 347.8 | 1027.8 | 300.3 | 286.4 | 114.5 | 85.5 | 423.3 | 161.3 | 633.9 | 231.6 |
| 11 | 370.0 | 1146.3 | 336.5 | 326.2 | 138.9 | 94.9 | 520.8 | 186.2 | 714.5 | 259.7 | |
| 2014 | 05 | 398.9 | 1274.5 | 359.2 | 317.2 | 163.6 | 101.5 | 614.9 | 214.3 | 808.3 | 282.3 |
| 11 | 407.6 | 1557.0 | 496.1 | 426.1 | 192.3 | 104.6 | 765.1 | 246.5 | 924.6 | 340.6 | |
| 2015 | 05 | 457.0 | 1928.9 | 525.6 | 440.2 | 198.9 | 117.5 | 955.6 | 287.5 | 941.5 | 308.1 |
| 11 | 452.9 | 2336.1 | 581.1 | 503.0 | 251.9 | 137.1 | 1306.4 | 366.6 | 1059.7 | 307.9 | |
| 2016 | 05 | 551.5 | 2863.3 | 652.7 | 570.5 | 277.0 | 112.6 | 1765.1 | 453.8 | 1080.1 | 292.4 |
| 11 | 602.5 | 3396.6 | 1246.0 | 653.6 | 311.0 | 113.6 | 1989.2 | 518.2 | 1221.9 | 535.8 | |
| 2017 | 05 | 954.8 | 5452.9 | 1390.0 | 597.19 | 590.5 | 179.1 | 3207.1 | 685.2.9 | 1283.1 | 322.6 |
| 11 | 779.1 | 5980.2 | 1428.9 | 688.1 | 690.6 | 157.1 | 3591.1 | 661.6 | 1437.5 | 362.5 | |
| 2018 | 05 | 870.1 | 6827.9 | 1441.9 | 726.4 | 736.8 | 214.7 | 3864.7 | 559.4 | 1746.4 | 452.6 |
| 11 | 929.1 | 7281.8 | 1921.4 | 867.5 | 964.9 | 283.4 | 4848.6 | 710.5 | 1669.2 | 400.9 | |
| 2019 | 05 | 1016.7 | 7859.6 | 2159.4 | 948.9 | 950.2 | 289.4 | 5519.1 | 848.9 | 1671.0 | 408.5 |
| 11 | 1073.0 | 8641.0 | 2323.4 | 956.5 | 994.1 | 290.8 | 6232.5 | 901.2 | 1995.5 | 540.9 | |
| 2020 | 05 | 1534.3 | 12575.6 | 2968.1 | 2420.1 | 1610.7 | 328.6 | 10065.5 | 1353.3 | 2945.8 | 724.5 |
| 11 | 1542.7 | 12885.5 | 2787.3 | 2552.4 | 1502.0 | 290.5 | 9380.0 | 1535.1 | 2603.5 | 593.5 | |
| 2021 | 05 | 1776.4 | 15264.6 | 3226.4 | 3084.7 | 1881.8 | 584.3 | 12454.5 | 1651.1 | 2946.1 | 715.6 |
| 11 | 1772.3 | 14885.5 | 3590.7 | 3147.5 | 2078.7 | 631.9 | 12906.8 | 1654.0 | 2518.9 | 820.7 | |
| 2022 | 05 | 1922.1 | 16180.7 | 3850.4 | 3530.7 | 2299.0 | 677.6 | 14178.9 | 1687.8 | 2492.9 | 914.1 |
| 11 | 1973.2 | 17749.1 | 4039.4 | 3827.9 | 2616.8 | 707.7 | 15662.5 | 1952.6 | 2687.0 | 939.1 | |
| 2023 | 05 | 2043.2 | 18200.6 | 4295.4 | 4104.3 | 2889.1 | 753.3 | 16016.7 | 2059.4 | 2860.3 | 986.9 |
| 11 | 2135.6 | 19814.9 | 4514.4 | 4607.7 | 3546.1 | 906.3 | 16830.3 | 2190.8 | 3154.6 | 962.7 | |
| 2024 | 05 | 2255.8 | 20476.3 | 4862.9 | 4677.2 | 3945.3 | 972.3 | 17052.8 | 2427.9 | 3011.4 | 1013.2 |
| 11 | 2420.7 | 21867.3 | 4928.8 | 4757.2 | 4154.7 | 1008.5 | 18268.6 | 2610.3 | 3106.7 | 980.5 | |
The annual growth rates over the years are summarized in Table 2. The growth rate is the ratio against the measurement one year before.
| year | month | (A1)customer-bb | (A2)customer-other | (B1)external-6ix | (B2)external-domestic | (B3)external-international | |||||
|---|---|---|---|---|---|---|---|---|---|---|---|
| in | out | in | out | in | out | in | out | in | out | ||
| 2005 | 11 | 1.265 | 1.460 | 2.228 | 1.904 | 1.421 | 1.458 | 1.468 | 1.573 | 2.004 | 2.383 |
| 2006 | 05 | 1.286 | 1.269 | 1.810 | 1.603 | 1.382 | 1.445 | 1.295 | 1.329 | 1.708 | 1.983 |
| 11 | 1.326 | 1.360 | 1.404 | 1.572 | 1.267 | 1.295 | 1.330 | 1.329 | 1.655 | 1.452 | |
| 2007 | 05 | 1.256 | 1.353 | 1.720 | 1.509 | 1.169 | 1.178 | 1.312 | 1.397 | 1.699 | 1.490 |
| 11 | 1.220 | 1.286 | 1.684 | 1.353 | 1.367 | 1.339 | 1.199 | 1.252 | 1.415 | 1.415 | |
| 2008 | 05 | 1.238 | 1.225 | 1.450 | 1.471 | 1.236 | 1.247 | 1.134 | 1.101 | 1.311 | 1.326 |
| 11 | 1.273 | 1.274 | 1.433 | 1.403 | 1.150 | 1.229 | 1.206 | 1.168 | 1.317 | 1.355 | |
| 2009 | 05 | 1.299 | 1.337 | 1.443 | 1.428 | 1.167 | 1.188 | 1.310 | 1.175 | 1.396 | 1.339 |
| 11 | 1.237 | 1.247 | 1.384 | 1.439 | 1.063 | 1.071 | 1.346 | 1.166 | 1.409 | 1.338 | |
| 2010 | 05 | 0.921 | 1.071 | 1.158 | 1.081 | 0.842 | 0.868 | 1.053 | 0.781 | 1.346 | 1.230 |
| 11 | 0.833 | 1.099 | 1.122 | 1.156 | 0.788 | 0.834 | 0.948 | 0.760 | 1.330 | 0.977 | |
| 2011 | 05 | 0.940 | 1.234 | 1.084 | 1.329 | 0.925 | 0.955 | 1.305 | 1.109 | 1.467 | 1.032 |
| 11 | 0.944 | 1.255 | 1.167 | 1.407 | 1.142 | 0.976 | 1.334 | 1.187 | 1.510 | 1.170 | |
| 2012 | 05 | 0.951 | 1.143 | 1.297 | 1.393 | 1.203 | 1.096 | 1.307 | 1.103 | 1.256 | 1.114 |
| 11 | 1.001 | 1.129 | 1.209 | 1.240 | 1.003 | 0.931 | 1.194 | 0.976 | 1.146 | 1.189 | |
| 2013 | 05 | 1.208 | 1.358 | 1.194 | 1.179 | 0.967 | 0.867 | 1.334 | 1.112 | 1.199 | 1.295 |
| 11 | 1.259 | 1.364 | 1.254 | 1.268 | 1.346 | 1.141 | 1.645 | 1.372 | 1.251 | 1.288 | |
| 2014 | 05 | 1.147 | 1.240 | 1.196 | 1.108 | 1.429 | 1.187 | 1.453 | 1.329 | 1.275 | 1.219 |
| 11 | 1.102 | 1.358 | 1.474 | 1.306 | 1.384 | 1.102 | 1.469 | 1.324 | 1.294 | 1.312 | |
| 2015 | 05 | 1.146 | 1.513 | 1.463 | 1.388 | 1.216 | 1.158 | 1.554 | 1.342 | 1.165 | 1.091 |
| 11 | 1.111 | 1.500 | 1.171 | 1.180 | 1.310 | 1.311 | 1.707 | 1.487 | 1.146 | 0.904 | |
| 2016 | 05 | 1.207 | 1.484 | 1.242 | 1.296 | 1.393 | 0.958 | 1.847 | 1.578 | 1.147 | 0.949 |
| 11 | 1.330 | 1.454 | 2.144 | 1.299 | 1.235 | 0.829 | 1.523 | 1.414 | 1.153 | 1.149 | |
| 2017 | 05 | 1.349 | 1.380 | 1.998 | 1.211 | 1.543 | 1.301 | 1.592 | 1.379 | 1.156 | 1.056 |
| 11 | 0.991 | 1.283 | 1.081 | 1.155 | 1.654 | 1.088 | 1.554 | 1.133 | 1.138 | 0.986 | |
| 2018 | 05 | 0.911 | 1.254 | 1.037 | 1.217 | 1.248 | 1.199 | 1.205 | 0.816 | 1.361 | 1.403 |
| 11 | 1.193 | 1.218 | 1.345 | 1.261 | 1.397 | 1.804 | 1.350 | 1.074 | 1.161 | 1.106 | |
| 2019 | 05 | 1.168 | 1.149 | 1.498 | 1.306 | 1.290 | 1.348 | 1.428 | 1.518 | 0.957 | 0.903 |
| 11 | 1.155 | 1.187 | 1.209 | 1.103 | 1.030 | 1.026 | 1.285 | 1.268 | 1.195 | 1.349 | |
| 2020 | 05 | 1.509 | 1.600 | 1.375 | 2.550 | 1.695 | 1.135 | 1.824 | 1.594 | 1.763 | 1.774 |
| 11 | 1.438 | 1.491 | 1.200 | 2.668 | 1.511 | 0.999 | 1.505 | 1.703 | 1.305 | 1.097 | |
| 2021 | 05 | 1.158 | 1.214 | 1.087 | 1.275 | 1.168 | 1.778 | 1.237 | 1.220 | 1.000 | 0.988 |
| 11 | 1.149 | 1.155 | 1.288 | 1.233 | 1.384 | 2.175 | 1.376 | 1.077 | 0.968 | 1.383 | |
| 2022 | 05 | 1.082 | 1.060 | 1.193 | 1.145 | 1.222 | 1.160 | 1.138 | 1.022 | 0.846 | 1.277 |
| 11 | 1.113 | 1.192 | 1.125 | 1.216 | 1.259 | 1.120 | 1.214 | 1.181 | 1.067 | 1.144 | |
| 2023 | 05 | 1.063 | 1.125 | 1.116 | 1.162 | 1.257 | 1.112 | 1.130 | 1.220 | 1.147 | 1.080 |
| 11 | 1.082 | 1.116 | 1.118 | 1.204 | 1.355 | 1.281 | 1.075 | 1.122 | 1.174 | 1.025 | |
| 2024 | 05 | 1.104 | 1.125 | 1.130 | 1.140 | 1.366 | 1.291 | 1.065 | 1.179 | 1.053 | 1.027 |
| 11 | 1.133 | 1.104 | 1.092 | 1.032 | 1.172 | 1.113 | 1.085 | 1.191 | 0.985 | 1.018 | |
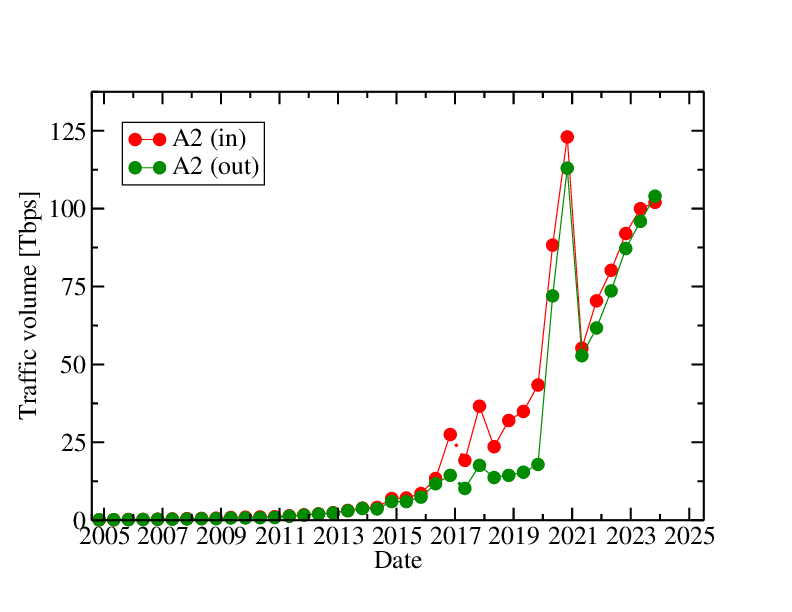
We can estimate the total customer traffic in Japan using the measurements from the 9 ISPs. We use the participating ISPs' share to compute the total traffic in Japan. For A1, the contract share of broadband services of the participating ISPs are used (assuming that customers traffic usage is similar among ISPs). For A2, the traffic share of the major IXes is used. However, the A2 data is provided only from 4 ISPs, and the A2 ratio differs from ISP to ISP. So, the number for A2 is just a very rough estimate.
| year | month | 6 ISPs | estimated A1 total | 3 ISPs | estimated A2 total | ||
|---|---|---|---|---|---|---|---|
| contract share(%) | in(Gbps) | out(Gbps) | IX traffic share(%) | in(Gbps) | out(Gbps) | ||
| 2004 | 09 | 52.2 | 188 | 214 | 14.9 | 94 | 91 |
| 10 | 52.2 | 208 | 239 | 15.2 | 99 | 98 | |
| 11 | 52.2 | 222 | 255 | 14.0 | 116 | 111 | |
| 2005 | 05 | 52.3 | 257 | 341 | 14.9 | 159 | 160 |
| 11 | 50.1 | 293 | 387 | 15.9 | 227 | 187 | |
| 2006 | 05 | 49.7 | 348 | 455 | 16.7 | 257 | 229 |
| 11 | 49.4 | 394 | 535 | 16.1 | 315 | 290 | |
| 2007 | 05 | 49.1 | 443 | 624 | 17.5 | 422 | 330 |
| 11 | 48.4 | 490 | 702 | 16.6 | 515 | 381 | |
| 2008 | 05 | 47.3 | 568 | 792 | 17.9 | 598 | 475 |
| 11 | 46.5 | 649 | 930 | 18.7 | 655 | 474 | |
| 2009 | 05 | 45.9 | 762 | 1090 | 17.4 | 887 | 698 |
| 11 | 45.1 | 828 | 1200 | 17.6 | 963 | 725 | |
| 2010 | 05 | 43.8 | 735 | 1220 | 16.9 | 1060 | 776 |
| 11 | 43.9 | 709 | 1350 | 17.0 | 1120 | 868 | |
| 2011 | 05 | 43.8 | 691 | 1510 | 13.8 | 1410 | 1260 |
| 11 | 44.1 | 666 | 1690 | 12.8 | 1730 | 1620 | |
| 2012 | 05 | 44.1 | 652 | 1710 | 12.4 | 2030 | 1960 |
| 11 | 44.3 | 664 | 1900 | 11.2 | 2400 | 2300 | |
| 2013 | 05 | 44.8 | 776 | 2290 | 9.56 | 3140 | 3000 |
| 11 | 44.6 | 830 | 2570 | 8.67 | 3880 | 3760 | |
| 2014 | 05 | 44.1 | 904 | 2890 | 8.76 | 4100 | 3620 |
| 11 | 43.7 | 932 | 3560 | 7.13 | 6960 | 5980 | |
| 2015 | 05 | 43.4 | 1050 | 4450 | 7.36 | 7140 | 5980 |
| 11 | 42.7 | 1060 | 5470 | 6.79 | 8560 | 7410 | |
| 2016 | 05 | 41.9 | 1320 | 6840 | 4.87 | 13400 | 17700 |
| 11 | 41.3 | 1460 | 8230 | 4.53 | 27500 | 14400 | |
| year | month | 9 ISPs | estimated A1 total | 4 ISPs | estimated A2 total | ||
| contract share(%) | in(Gbps) | out(Gbps) | IX traffic share(%) | in(Gbps) | out(Gbps) | ||
| 2017 | 05 | 67.9 | 1370 | 7840 | 6.80 | 19200 | 10200 |
| 11 | 67.2 | 1130 | 8690 | 3.90 | 36600 | 17600 | |
| 2018 | 05 | 66.5 | 1310 | 10300 | 6.21 | 23600 | 13700 |
| 11 | 66.3 | 1400 | 11000 | 6.01 | 32000 | 14400 | |
| 2019 | 05 | 65.0 | 1560 | 12100 | 6.18 | 34900 | 15400 |
| 11 | 68.3 | 1570 | 12600 | 5.35 | 43400 | 17900 | |
| 2020 | 05 | 66.1 | 2320 | 19000 | 3.36 | 88300 | 72000 |
| 11 | 65.0 | 2330 | 19500 | 2.26 | 123000 | 113000 | |
| 2021 | 05 | 63.9 | 2780 | 23900 | 5.84 | 55200 | 52800 |
| 11 | 62.9 | 2820 | 23700 | 5.10 | 704000 | 617000 | |
| 2022 | 05 | 62.3 | 3090 | 26000 | 4.80 | 80200 | 73600 |
| 11 | 60.1 | 3280 | 29500 | 4.39 | 92000 | 87200 | |
| 2023 | 05 | 59.6 | 3430 | 30500 | 4.28 | 100000 | 95900 |
| 11 | 57.4 | 3720 | 34500 | 4.44 | 102000 | 104000 | |
| 2024 | 05 | 56.8 | 3970 | 36000 | 4.39 | 111000 | 107000 |
| 11 | 56.2 | 4310 | 38900 | 4.23 | 117000 | 112000 | |